Debug a macro
SAS has no debugger for macros. The usual way is OPTIONS MPRINT MLOGIC SYMBOLGEN; and a long log. The DataStep Studio macro debugger steps through a macro line by line. You see every macro variable change, you can go into a called macro, and afterwards you see which lines ran and how often.
%pry (chapter 24) and the macro debugger do the same job in two ways:
Use %pry when | Use the macro debugger when |
|---|---|
you know where to look: write one line, press F4 | you want to walk through a whole macro, line by line |
| the macro is called deep inside a long program | you want to test one macro with different parameters |
you want to look at data with vt, freq, dups | you want code coverage: which lines ran, which never ran |
The macro debugger is in the Professional edition, free during Early Access at the time of writing. The keys are on the cheat sheet.
25.1 The keys
Section titled “25.1 The keys”Put the cursor in a macro and click Debug Macro in the title bar: a call pane opens. Start Debug starts. Then F5 runs to the next breakpoint, F10 runs one line, F11 goes into a called macro and Shift+F11 goes back. All keys are on the cheat sheet.
25.2 Session 1: stop in the third round of a loop
Section titled “25.2 Session 1: stop in the third round of a loop”/* Chapter 24: a macro to practise %pry, one subset per severity */%MACRO by_sev(data=refadm.adae, sevs=MILD MODERATE SEVERE); %LOCAL i sev nsub; %DO i = 1 %TO %SYSFUNC(COUNTW(&sevs., %STR( ))); %LET sev = %SCAN(&sevs., &i., %STR( )); DATA _sev; SET &data.; WHERE trtemfl = "Y" AND aesev = "&sev."; RUN; /* write %pry(when=&i. = 3) on the next line to stop here */ PROC SQL NOPRINT; SELECT COUNT(DISTINCT usubjid) INTO :nsub TRIMMED FROM _sev; QUIT; %PUT NOTE: &sev.: &nsub. subjects with a treatment-emergent AE; %END;%MEND by_sev;
%by_sev()- Put the cursor in
%by_sevand click Debug Macro. What you should see: a call pane above the macro, with every parameter ready:dataandsevs. - Click in the margin of the line
%LET sev = %SCAN(&sevs., &i., %STR( ));to set a breakpoint. Right-click the red dot → Edit Condition →&i. = 3. - Click Start Debug. What you should see: the debugger stops at the first statement of the macro. The Variables view shows the macro variables in three groups: Local (the macro’s own variables), Global and Automatic.
- Press
F5. What you should see: the stop at the breakpoint in round 3:i = 3, butsev = MODERATEandnsub = 130. The%LEThas not run yet, so you see the values of round 2. - Open Libraries and double-click
WORK._SEV: 354 rows, the MODERATE records of round 2. - Press
F10. What you should see:sev = SEVERE. - In the Debug Console, type
%EVAL(&i. * 2). What you should see:6. The Debug Console evaluates macro expressions and runs SAS code inside the paused macro. - Set a second breakpoint on the
%PUTline and pressF5. What you should see: the DATA step and the PROC SQL of round 3 have run:nsub = 29, andWORK._SEVnow has 41 rows. - Remove the breakpoints and press
F5to the end. What you should see: each line of the macro shows how often it ran:×3on the lines inside the loop,×1on the lines before it.
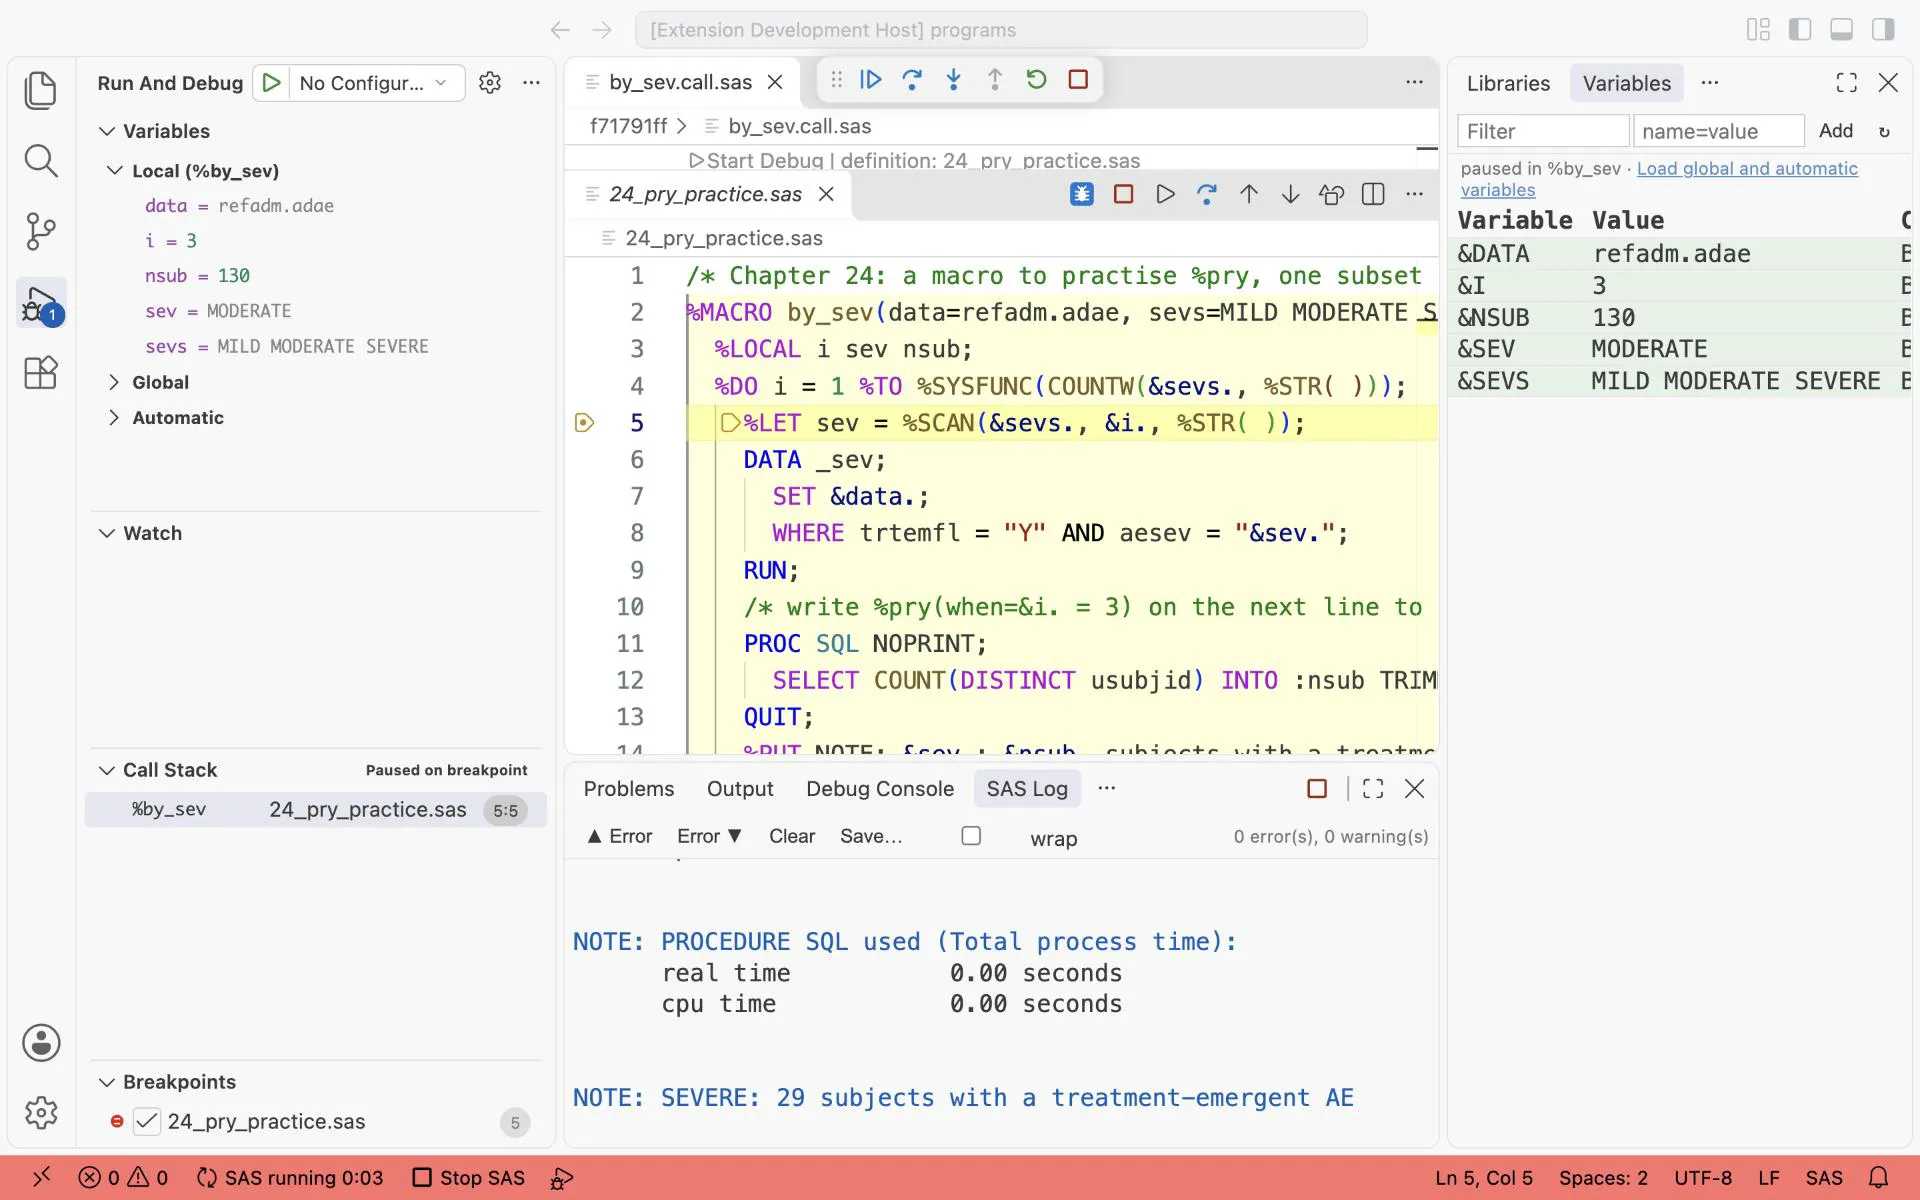
The macro debugger at the %LET sev line with the condition &i. = 3. i is already 3, but sev still holds MODERATE and nsub 130 from the last round: the highlighted line has not run yet.
25.3 Session 2: into a called macro, and back
Section titled “25.3 Session 2: into a called macro, and back”08_scope.sas has a macro %outer that calls %inner.
- Put the cursor in
%outer, click Debug Macro, and set a breakpoint on the line%inner(). - Click Start Debug and press
F5. - Press
F11. What you should see: the Call Stack shows%innerabove%outer. In the Variables view,where = outercomes from the contextOUTER:%innerhas nowhereof its own. - Press
Shift+F11to go back to%outer.
25.4 Session 3: coverage shows the code your test never reached
Section titled “25.4 Session 3: coverage shows the code your test never reached”08_2_count_by.sas checks its parameters before it counts. A normal call never runs these checks.
- Run
08_1_utility.sasfirst:%count_bycalls%varexist. - Put the cursor on the call
%count_by(data=refadm.adae, by=trtan aesev, where=%STR(trtemfl = "Y"))at the bottom of the program and click Debug Macro. What you should see: DataStep Studio finds the macro, opens it, and puts your call, exactly as written, in the call pane. - Click Start Debug, then
F5to the end. What you should see: the lines in the%DOloop over the BY variables show×2(TRTAN and AESEV). The three%PUT %STR(ERR)OR:lines are marked as not reached.
Lines that never ran are lines no test has checked. 08_3_count_by_errors.sas calls %count_by with wrong parameters; debug one of those calls and its ERROR line is reached. Workflow 3 builds a macro with its tests from the start.
25.5 Debug straight from your program
Section titled “25.5 Debug straight from your program”You do not have to copy a call into the call pane. Put the cursor on any call in your program, for example the first %m_baseline( call in 10_2_advs_bp.sas, and click Debug Macro. DataStep Studio looks for the macro in the files your program %INCLUDEs, in its folder and in the macros folders, opens it, and puts your call in the call pane. This works for a macro defined in another file. When the same file defines and calls the macro, start from its %MACRO line and write the call in the pane.
In a new window, the first Debug Macro from a call can fail with cannot open sas-call:/…call.sas. Click Debug Macro again: the second time it works.
Run your program up to the call first, for example with Run To Line (Ctrl+Alt+Up), so the data the macro reads exists.
Exercises
Section titled “Exercises”Exercise 25-1. Debug %by_sev with sevs = SEVERE MILD. Which values does i take, and how often does the loop line run?
Exercise 25-2. In session 3, call %count_by(data=refadm.adae, by=trtan nosuchvar) from the call pane. Which line is reached now?
Exercise 25-3. Define a macro without parentheses, %MACRO hello;, and click Debug Macro. What does the call pane write? Fix the definition.
Answers: Chapter 25 answers.
Next: develop like a senior.